

So here we are. The UK Bank Rate now stands at 5%. Price inflation remains stubbornly high at 8.7%.
The next interest rate decision by the Bank of England will be on 3rd August 2023. The Bank Rate is expected to continue rising until year-end, potentially peaking at 6.25%.
What does all this mean for investors? In last week’s guest article Taking Stock – Risk and Return | Quilter Cheviot, David Henry eloquently said:
if taking some risk by providing capital to businesses won’t generate returns in excess of this higher cash rate, then what is the point of investing?
We learned in David’s article that historically equities (i.e. company shares) have outperformed cash over most investment periods:
-Over 5-year rolling periods, shares beat cash returns 74.2% of the time
-Over 10-year rolling periods, shares outperformed cash 85.5% of the time
-Over 15-year rolling periods, shares outperformed cash 91.3% of the time
The longer the time, the greater the likelihood that shares will beat cash returns.
David also pointed out that,
when shares beat cash over rolling 15-year periods, they have outperformed by 4.7% a year on average. In contrast, when cash has outperformed shares over the same 15-year periods, the average gap is a lot closer – 0.8% per annum.
This shows that taking risks pays off most of the time. However, returns are uncertain and are not guaranteed.
It certainly makes sense to hold cash for short-term objectives and planned expenditure and as a buffer for unplanned spending. The appropriate level of cash reserves will depend on each person’s individual circumstances.
In financial planning, we don’t try to predict investment returns, deposit rates, or inflation over the next year or two. We think in decades and plan based on conservative assumptions about the future.
The longer your time horizon, the less safe cash becomes. This is because inflation erodes the spending power of money.
For example, over the last 20 years, inflation has halved the value of money in the UK. This represents a permanent loss of purchasing power.
Historical data shows that shares are most likely to beat inflation over the longer term.
Physical property over the long term has outpaced inflation too. However, property is expensive to buy and maintain, taxed unfavourably and sometimes difficult to sell.
At the same time, not all of us are prepared to or should invest solely in company shares. We can still earn higher returns than from cash by adding bonds and other traditionally more defensive assets to the investment mix.
What to expect from portfolios over the next ten years? The below chart shows a range of expected returns for different portfolios, with an equities (i.e. company shares) allocation ranging from 20% to 100% and the balance invested in bonds.
The chart was produced by Vanguard, one of the world’s largest asset managers. It is slightly dated, as it is based on September 2022 asset prices, but is nonetheless a helpful visual (see disclosure).
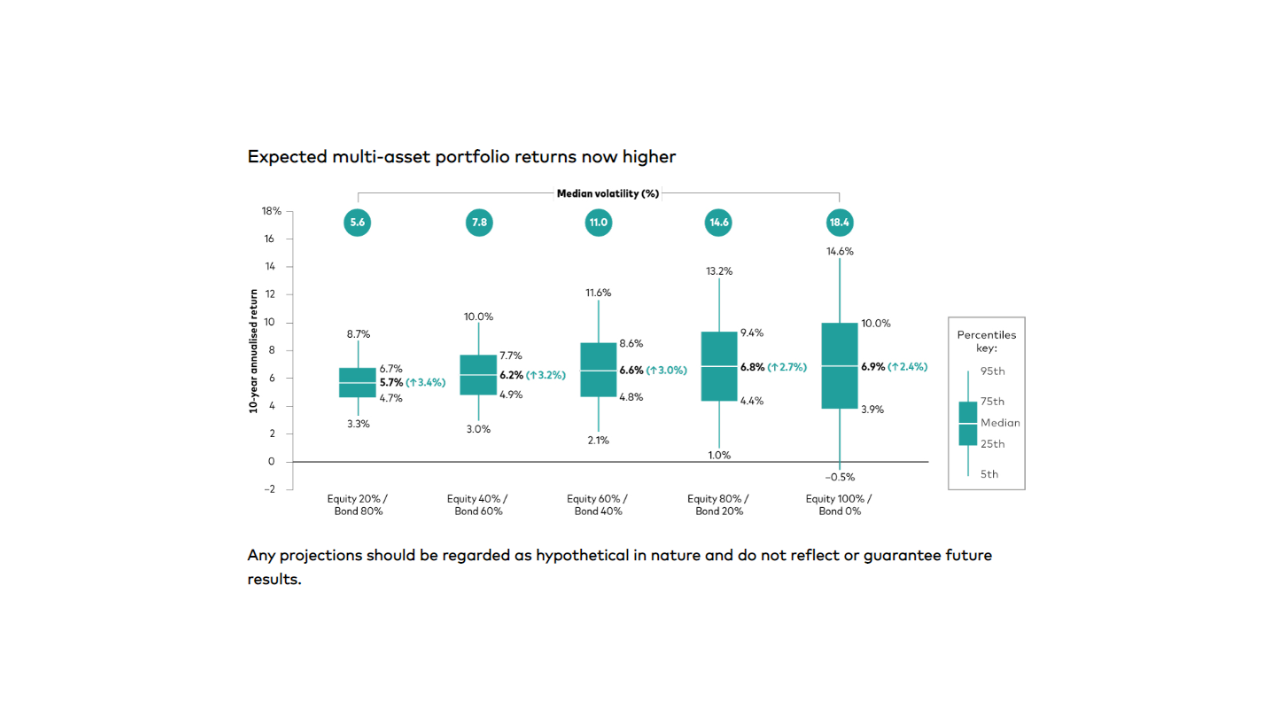
The chart illustrates that the higher the allocation to shares, the higher the expected returns, but outcomes can vary quite widely compared to expectations. It is also apparent that the portfolios with the highest bond allocation have seen the most improvement in expected returns (see green figures in brackets).
The chart shows that a 60% shares portfolio could potentially earn an estimated average annual return of 6.6% over a 10-year period. However, we know that returns can vary significantly from year to year.
The average is just that – an average. You might never earn the average return.
The annual returns could be as high as 11.6% or as low as 2.1%, but are more likely to range between 4.8% and 8.6%. More extreme outcomes are also possible.
Every 3 to 5 years, investors should be prepared to see this portfolio fall by approximately 20%. However, these are temporary declines unless one capitulates and sells the portfolio at the worst possible time.
The illustrative portfolio returns are higher than the expected returns from cash over the next decade but are more uncertain. The deposit rates are high now but likely to decrease gradually as inflation slows.
Successful long-term investors must accept uncertainty, knowing that this is the price for earning higher long-term returns. It is also important to remember that falling and sideways markets generally increase expected future returns.
For savers, this means you are buying more portfolio units at cheaper prices. The key is to stay invested, tune out the noisy and negative news headlines, and have sufficient cash reserves to weather the temporary market declines.
Disclosure: The illustrative returns are not guaranteed but are based on Vanguard’s assumptions about the future based on asset prices as of 30th September 2022. The asset class returns reflect the reinvestment of dividends and capital gains, and do not take into account fees and taxes. Vanguard have since revised their return projections slightly downwards for global asset and revised them slightly upwards for Sterling assets.